Business
Bitcoin Price Shows Signs of Reversal and Potential Upward Trend

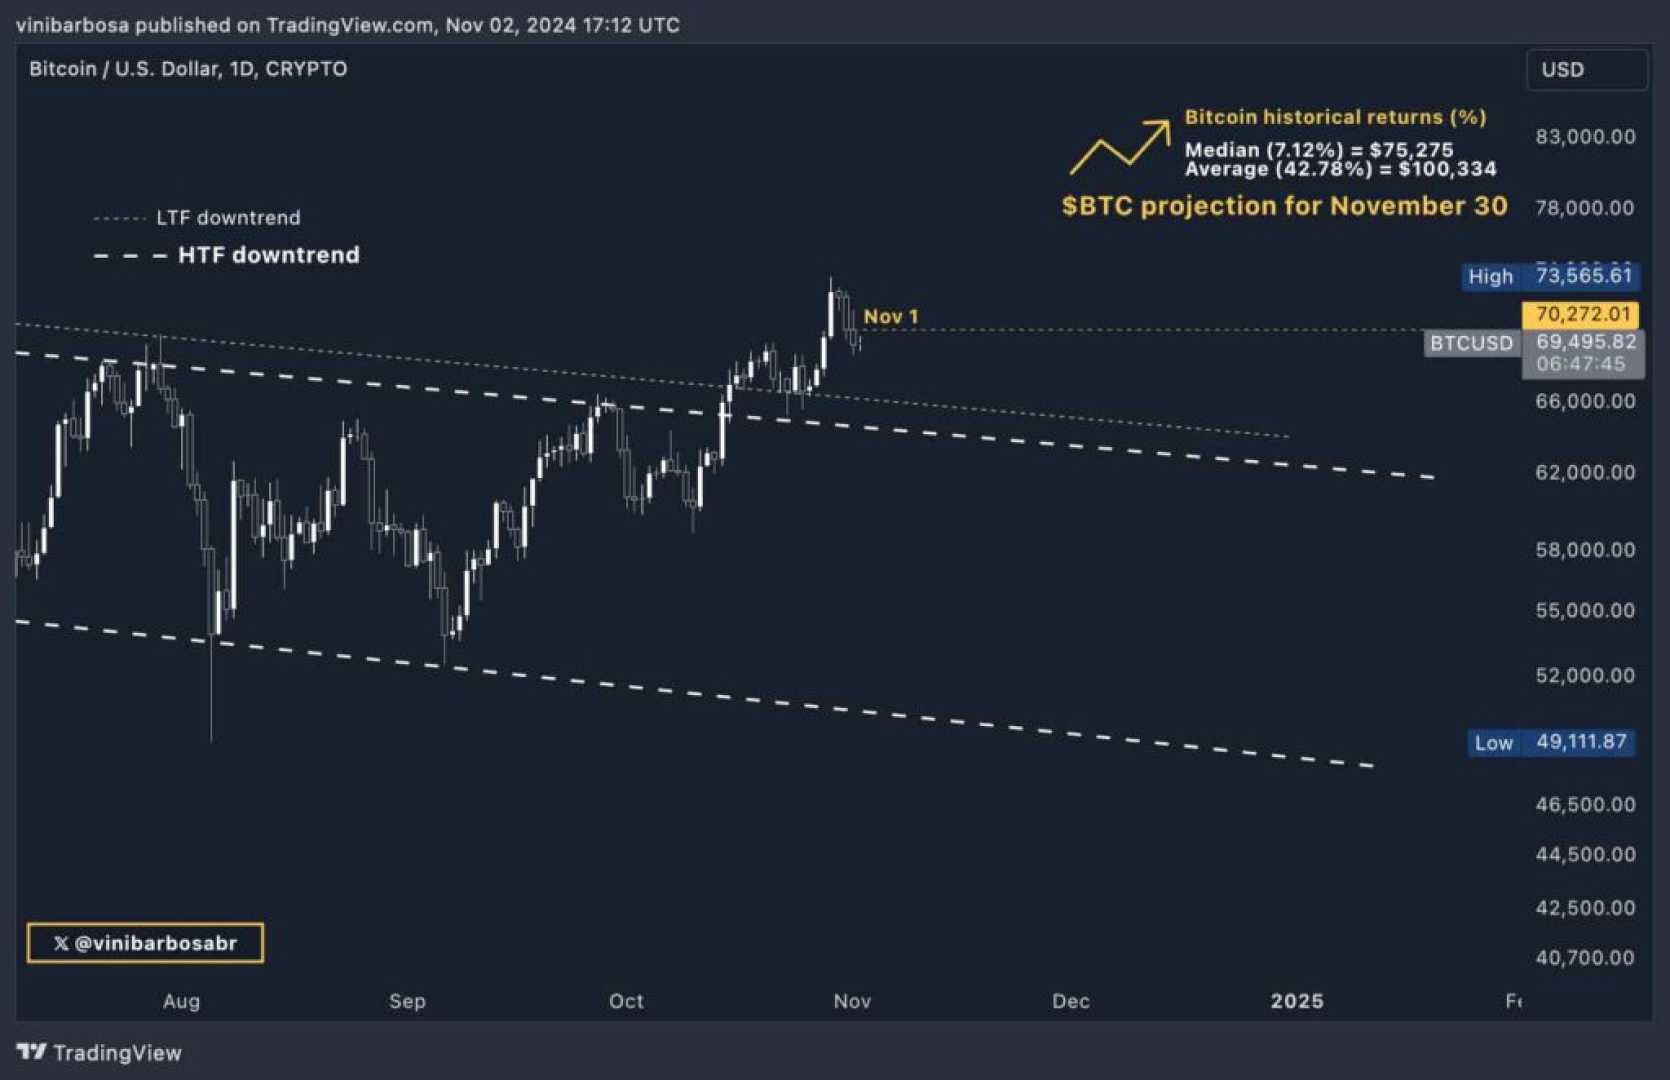
As of November 6, 2024, the Bitcoin price is exhibiting indications of a potential reversal, suggesting a fresh upward trend. The price has been consolidating around the $68,685 mark and is showing signs of regaining momentum towards or above the $70,000 level.
The immediate support level at $67,663 is crucial for assessing whether Bitcoin can continue to gain ground. If this level holds steady, it could serve as a launching pad for further bullish movement. Breaking through the $70,000 barrier, a significant technical and psychological level, could open the door to a new rally and indicate a change in market sentiment.
Recent market activity has been influenced by various factors, including the U.S. presidential election. Bitcoin slightly recovered to around $68,800 on Tuesday as former President Donald Trump took the lead in the polls. This recovery followed significant outflows from US spot Bitcoin ETFs on Monday, totaling over $541 million.
The Relative Strength Index (RSI) on the daily chart is currently at 55, indicating some signs of recovery in bullish sentiment. However, the Moving Average Convergence Divergence (MACD) indicator suggests a bearish crossover, which could indicate downward momentum if not reversed.
In addition to these short-term movements, the broader context includes the upcoming Bitcoin halving in April 2024, which historically has led to increased prices due to reduced supply and anticipated demand. The halving event, where the rewards to miners are cut in half, is expected to maintain Bitcoin’s value as a deflationary currency.
MicroStrategy‘s recent announcement of a $42 billion capital plan to buy Bitcoin also highlights ongoing institutional interest in the cryptocurrency, which could further support its price).


