News
NVIDIA’s Market Struggles: A Deep Dive into Recent Performance

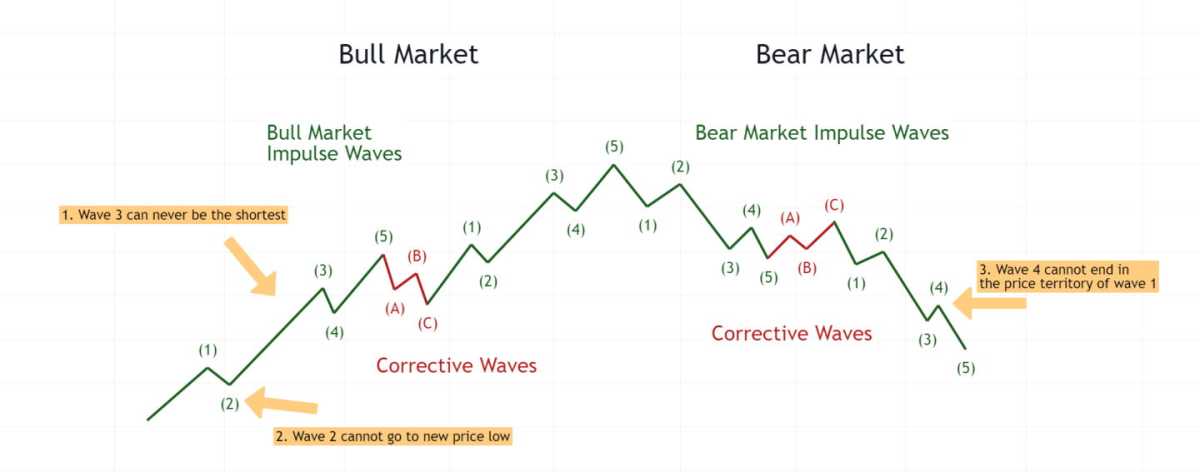
NVIDIA Corp. is under the microscope as analysts provide insights into its recent market performance. According to Elliott Wave Theory, NVDA seems to be entering a corrective phase, particularly marked by a bearish trend.
The daily chart analysis indicates that NVIDIA may have topped out in wave (5), failing to hold above the medium-grade support level at $100. The failure to find solid support could lead to significant downside potential.
For traders watching closely, a clear break and retest of a key trendline, noted as TL1, at that $100 mark would add to the bearish sentiment for the longer term.
Taking a closer look at the 4-hour chart reveals that there might still be some room for a temporary bounce. Analysts speculate this could occur in either wave B or wave 2, offering a small relief rally before heading back down.
This brief uptick could be seen as a prelude to a more significant decline, with the possibility of breaking below the $100 barrier as the market continues its corrective phase.


