Health
A New Map Reveals Air Quality Disparities Across the U.S.

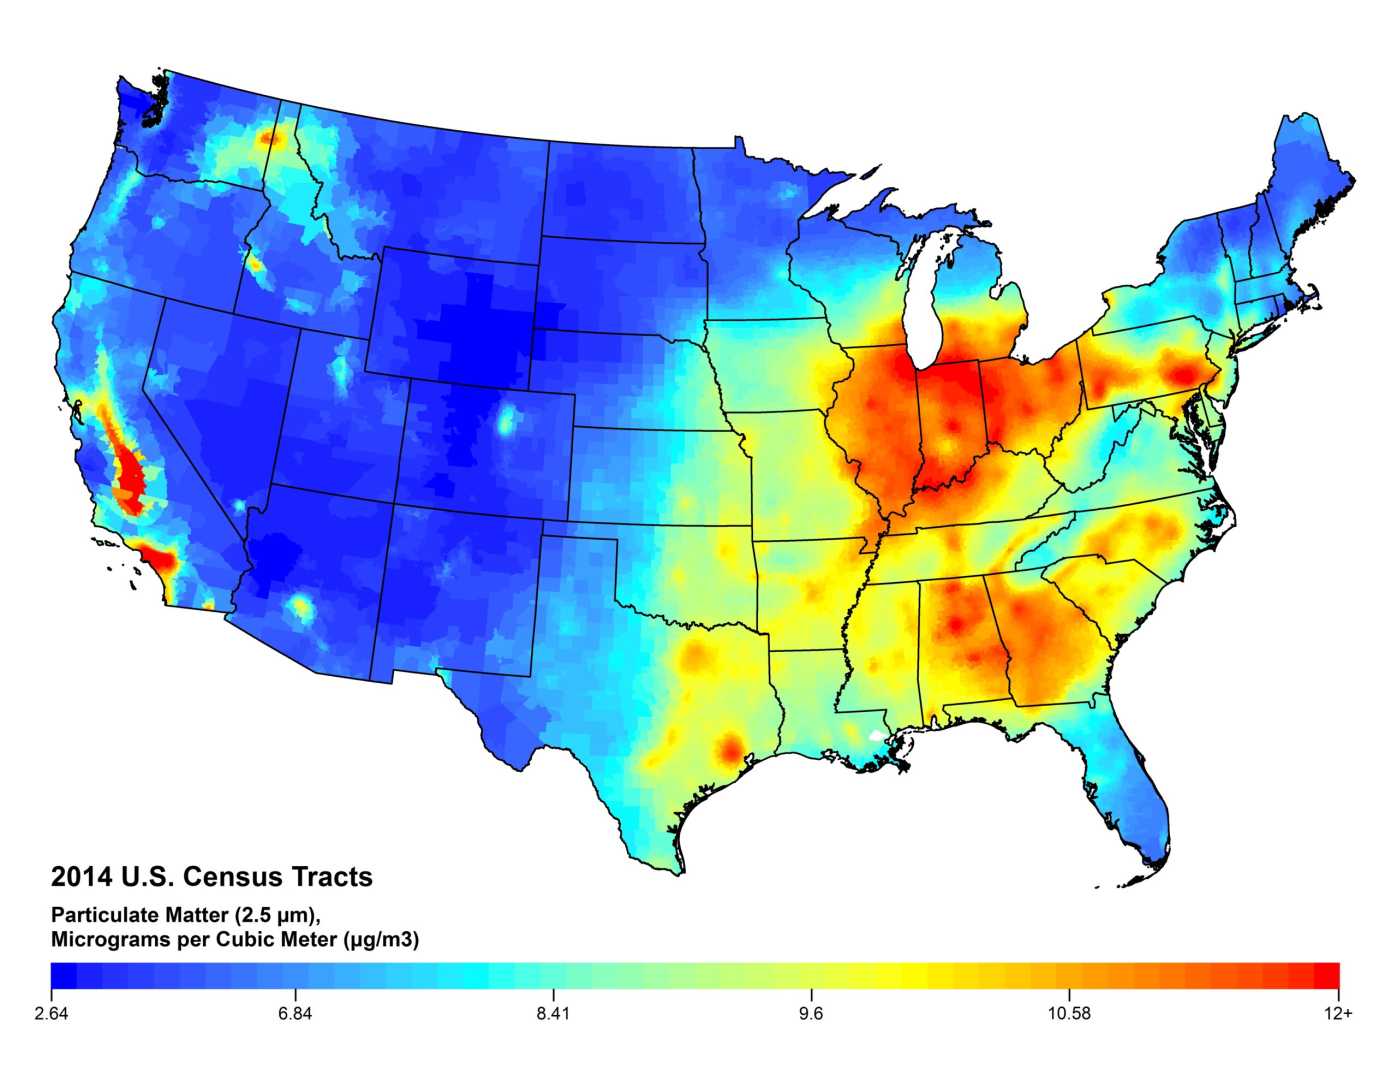
Washington, D.C. — A new map highlights significant air quality disparities throughout the United States, revealing troubling trends in both urban and rural areas. Researchers compiled data to examine the average concentration of PM2.5, a harmful fine particulate matter, in various states and cities.
PM2.5 particles are 2.5 microns or smaller and can penetrate deep into the lungs, potentially leading to tissue damage and lung inflammation. This type of air pollution is typically generated by burning fossil fuels and wood.
The study, based on data from the Air Quality Index, assessed PM2.5 concentrations in 2024, factoring in the contributions of larger cities to state averages. The findings show that many regions in the South face significant air quality challenges.
Georgia stands out with the highest PM2.5 concentration at 8.9 µg/m³, surpassing the World Health Organization’s guideline of 5 µg/m³. Idaho follows closely with a PM2.5 level of 8.7 µg/m³, marking the worst air quality in the northern states.
The report ranks the ten states with the worst air quality as follows: 1) Georgia (8.9 µg/m³), 2) Arkansas (8.8 µg/m³), 3) Idaho (8.7 µg/m³), 4) Mississippi (8.3 µg/m³), 5) Texas (8.3 µg/m³), 6) Oklahoma (8.3 µg/m³), 7) Louisiana (7.8 µg/m³), 8) Kansas (7.8 µg/m³), 9) Illinois (7.8 µg/m³), and 10) Ohio (7.7 µg/m³).
On the other hand, Hawaii boasts the cleanest air quality with an average PM2.5 concentration of 3.4 µg/m³. Other states with favorable air quality include 2) Alaska (3.6 µg/m³), 3) Rhode Island (3.6 µg/m³), and 4) Washington (4.8 µg/m³).
While Idaho ranks among the states with the worst air pollution, only one city from the state, Nampa, appears in the top ten cities for the worst air quality. In contrast, California cities dominate this list, with Ontario leading at a worrying 14.3 µg/m³.
The ten cities with the poorest air quality include: 1) Ontario, California (14.3 µg/m³), 2) Orange, California (13.6 µg/m³), 3) San Bernardino, California (12.9 µg/m³), 4) Fontana, California (12.7 µg/m³), 5) Visalia, California (12.5 µg/m³), 6) Nampa, Idaho (11.7 µg/m³), 7) West Covina, California (11.6 µg/m³), 8) Pomona, California (11.1 µg/m³), 9) Pasadena, California (11.0 µg/m³), and 10) Riverside, California (10.9 µg/m³).
Interestingly, several California cities also rank among those with the best air quality. The top cities for clean air include: 1) Anchorage, Alaska (3.1 µg/m³), 2) Bellevue, Washington (3.5 µg/m³), 3) Daly City, California (3.8 µg/m³), 4) West Jordan, Utah (3.9 µg/m³), 5) San Mateo, California (4.0 µg/m³), 6) San Rosa, California (4.0 µg/m³), 7) Honolulu, Hawaii (4.1 µg/m³), 8) Seattle, Washington (4.1 µg/m³), and 9) Berkeley, California (4.2 µg/m³).


